
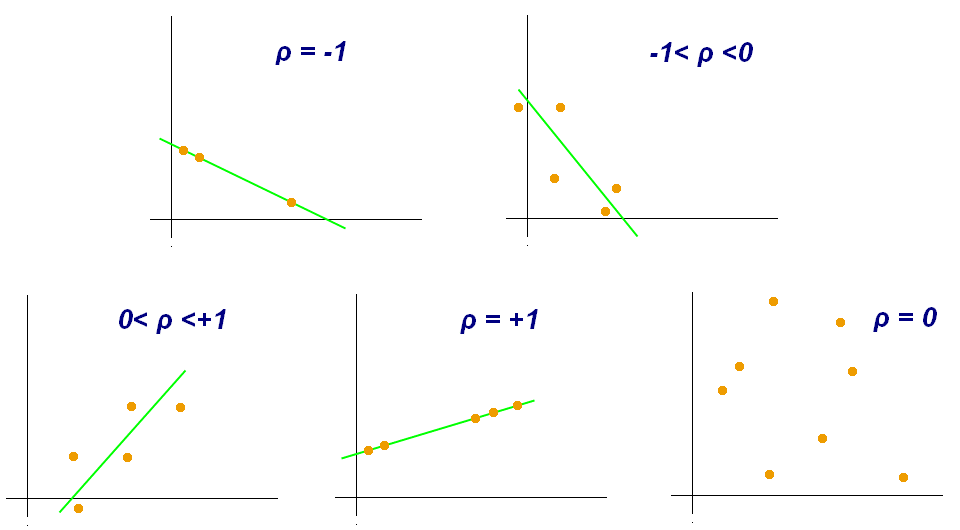
Pearson correlation
This allows to measure the linear relationship between two continuous variables. It ranges from -1 to 1, and indicates the direction and strength of the association.
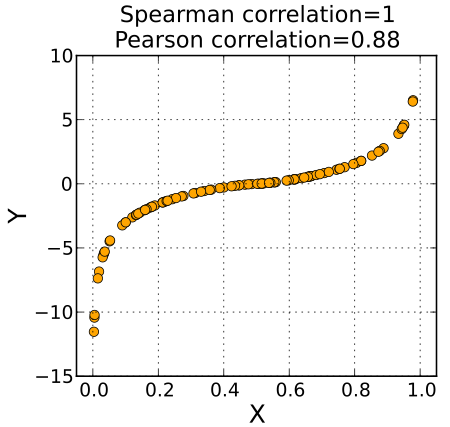
Spearman Correlation
It measures how well two variables are related by ranking their values. If one variable consistently increases or decreases as the other changes, they have a strong Spearman correlation. It works even if the relationship is not linear, making it useful when data isn’t normally distributed or has outliers. This makes this tool particularly useful when we suspect a non-linear relationship.
T-test
It checks if the averages (means) of two groups are significantly different from each other. It works by comparing the difference between the group means relative to the variation within the groups. If the difference is large compared to the variation, the t-test suggests that the groups are likely different. This tests assumes the data is roughly normaly distributed. You can learn more about it here.
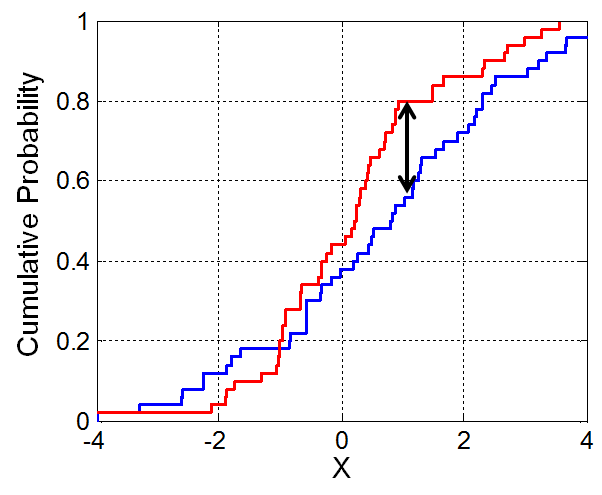
Kolmogorov-Smirnov Test
The Kolmogorov-Smirnov (KS) test compares two datasets to see if they come from the same distribution. It looks at the biggest difference between their cumulative distributions. If this difference is large, the test suggests the datasets are from different populations. The KS test works with any type of continuous data and doesn’t assume a specific distribution. This makes it useful for checking the conformity of our data.
OLS (Ordinary Least Square) Regression
This regression finds the best-fitting line through data points by minimizing the distance between observed and predicted values. It works by adjusting the line to reduce the sum of squared errors. It assumes a linear relationship, constant variance of errors, and normally distributed residuals. You can find more
here.
GLS (Generalized Least Squares)
This model extends OLS by handling situations where data points have different variances or are correlated. It adjusts the model to account for these issues and gives more accurate estimates. It is particularly useful in time series, where observations are often dependent or have unequal variability. You can find more here.
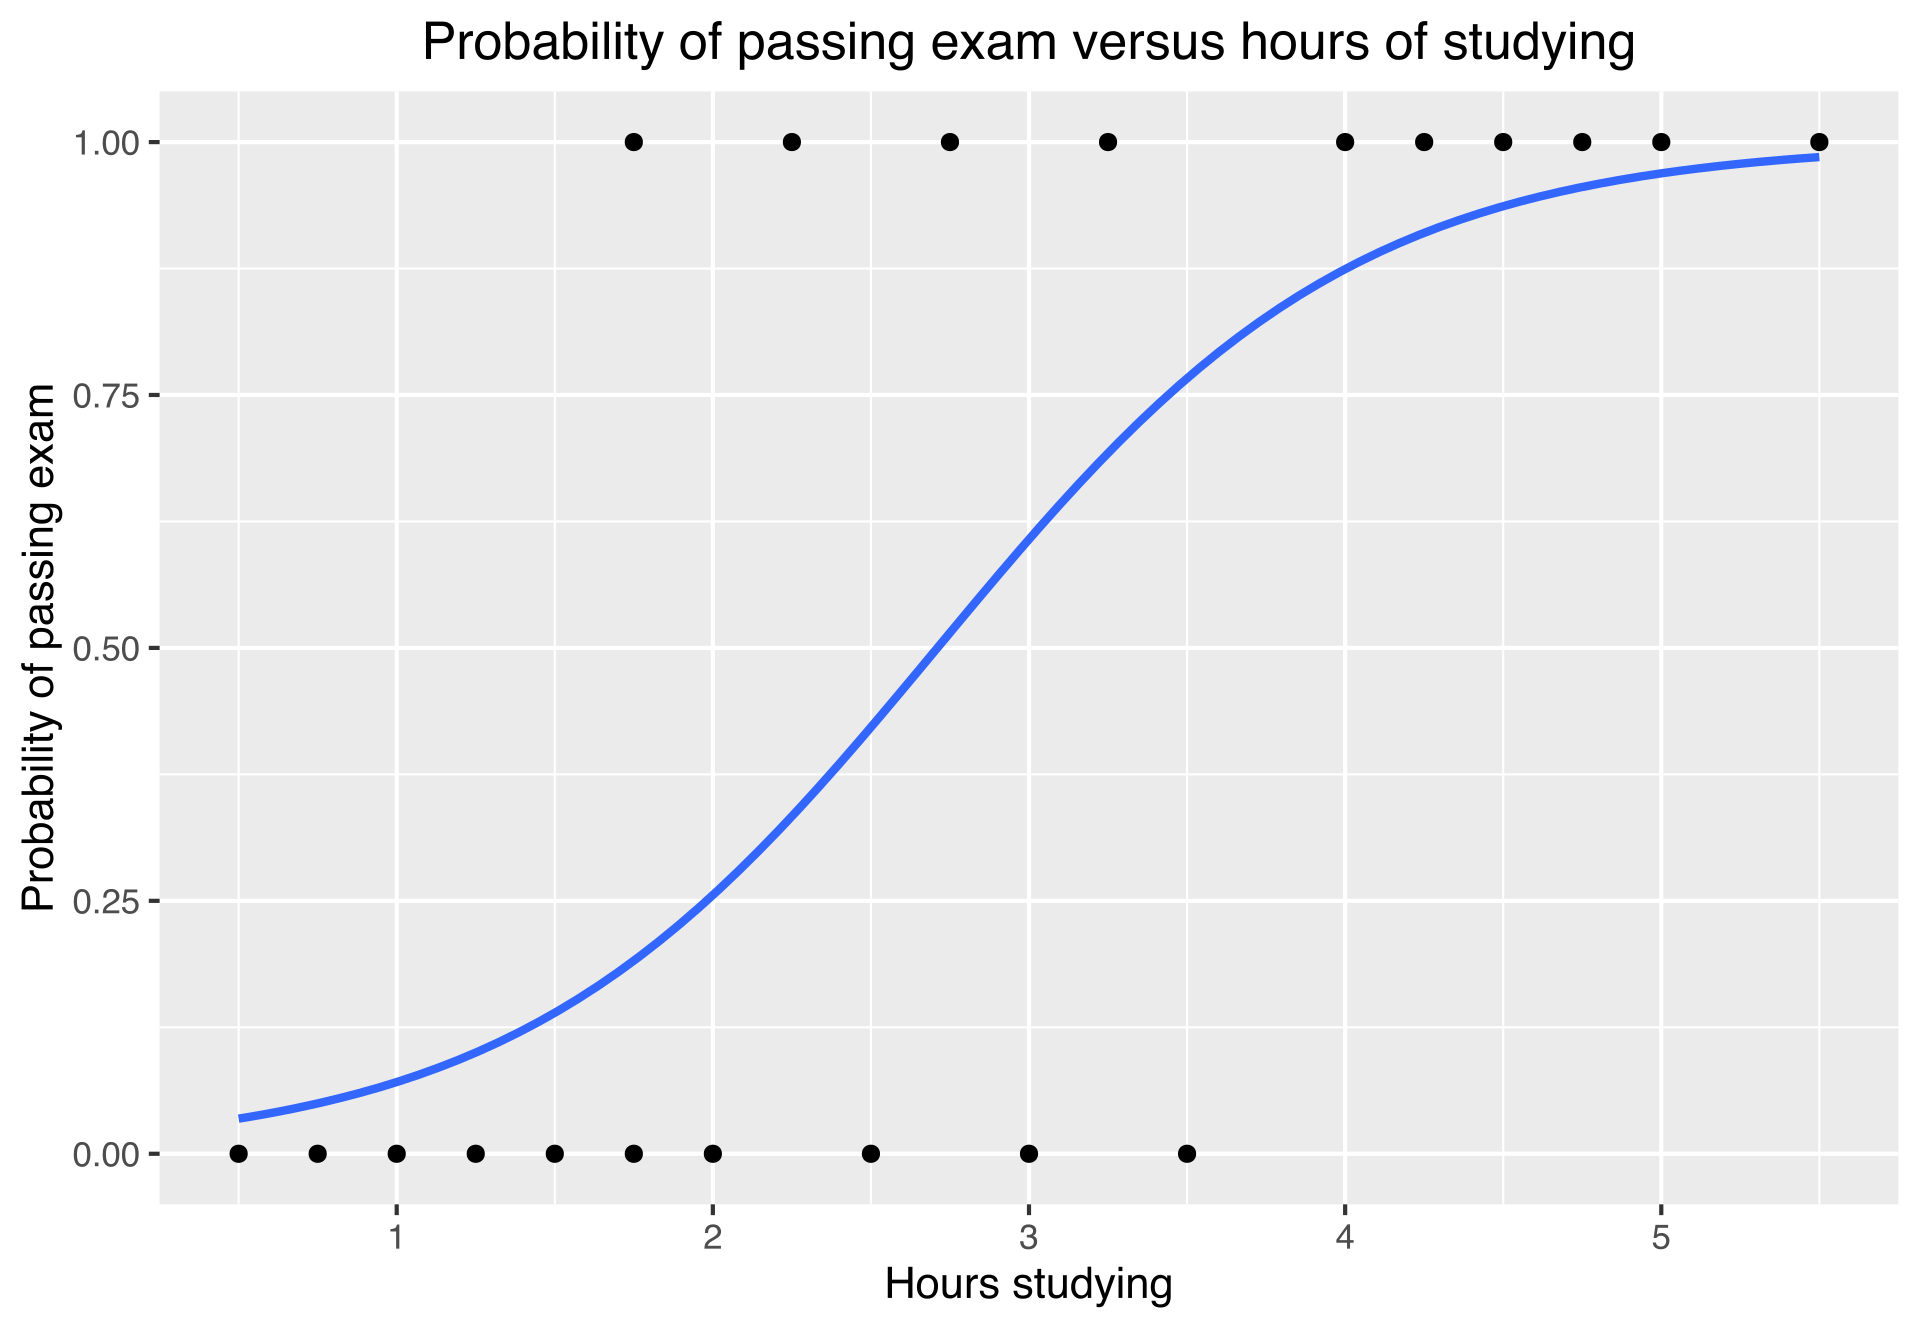
Logistic Regression
Logistic regression predicts binary outcomes (e.g., success/failure) instead of continuous values like OLS. It estimates the probability of an event using a logistic curve, producing results between 0 and 1. It is very useful for classification tasks.
Propensity Score Matching
This method pairs individuals from two groups (e.g., treated and control) based on similar characteristics. It first calculates a score that predicts the likelihood of being in one group based on observed variables. By matching individuals with similar scores, we create comparable groups and reduce the bias when estimating the treatment effects. You can find more here.
Principal Component Analysis (PCA)
This method reduces the number of dimensions by combining variables that explain the most variance in the data. The first principal component captures the largest amount of variance, followed by the second, and so on. This simplifies the dataset while preserving its most important information. You can learn more here.